
My first post about the assessment of the “Gaza Crisis Atlas 2014” was a “big picture” analysis. Now I’m going to analyse damage clusters in a more detailed way.
The least severe OCHA damage classification “Crater/Impact” is most probably an air strike or detonation of a launcher. They are predominantly mapped in open areas like fields, sand dunes and other empty lots around the Gaza Strip.
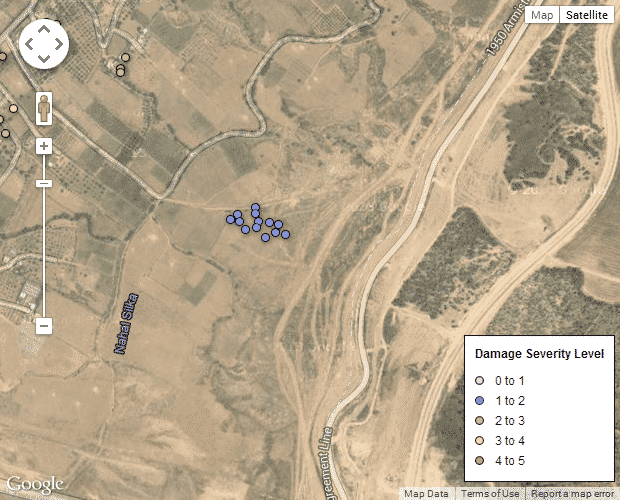
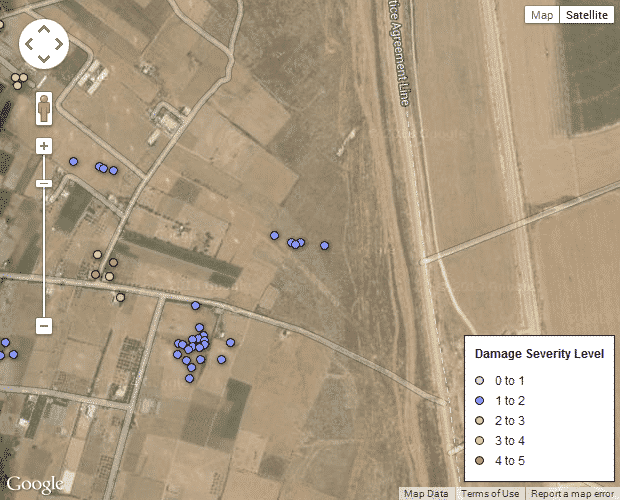
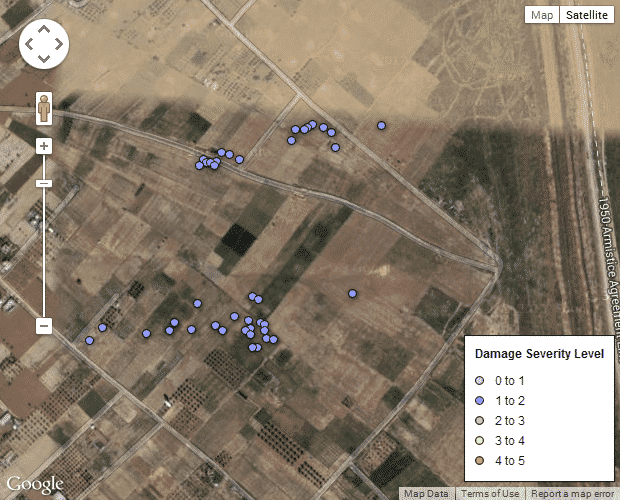
As it turns out, they also plot several of the Hamas terror tunnels dug from Gaza to Israel that were used for terror attacks and kidnappings. These appear as linear clusters of severity level 1 damage points, at a right angle to the Israel-Gaza border, and heading toward Israeli civilian communities.
The following 6 maps are screenshots. Click and you’ll be directed to the live map.
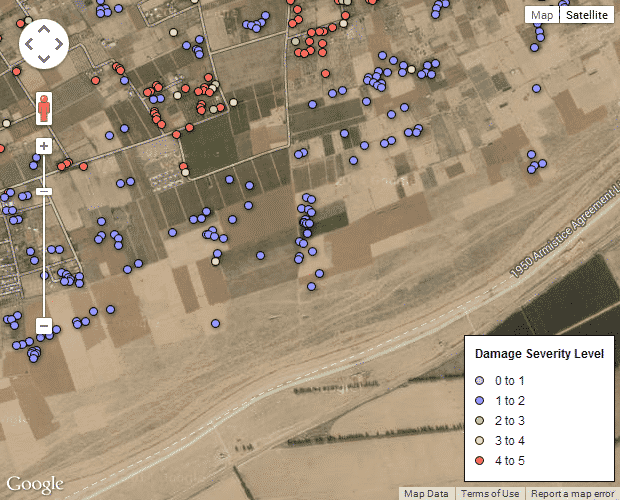
Cluster 1: West of Kissufim
Cluster 2: West of Nirim
Clusters 3a and 3b: Between Nirim and Nir Oz
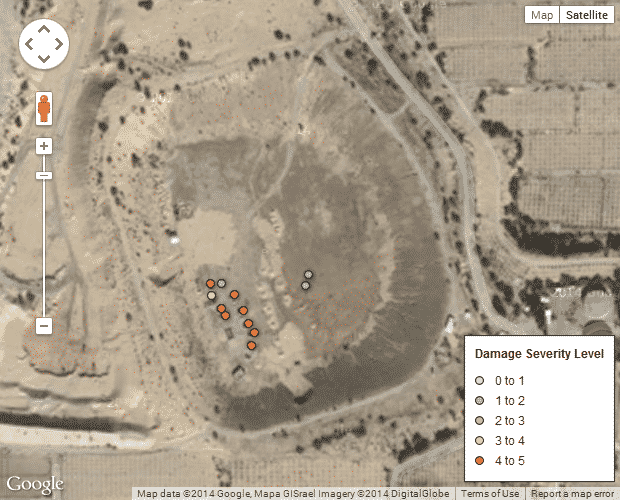
Cluster 4: West of Nir Oz
Cluster 5: North west of Sufa
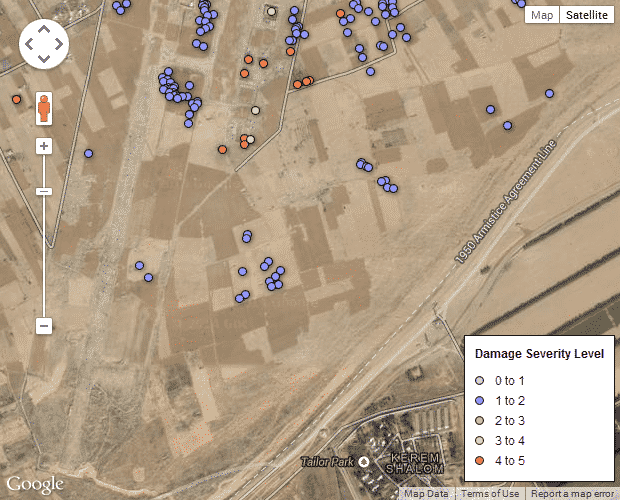
Clusters 6a and 6b: North of Kerem Shalom
There are several more clusters, less visibly obvious, but you get the picture. Compare the OCHA data with a map of Hamas infiltration tunnels made by Patrick Megahan of QME:
Since the start of Israel’s Operation Protective Edge on July 17, the Israel Defense Forces (IDF) discovered and destroyed 32 tunnels built by the terrorist group Hamas. 14 of those tunnels are reported to have crossed into Israel from the Gaza Strip. Based on press reports and the IDF, it is possible that as many as 15 tunnels may have gone into Israel and, of those, seven were used to conduct attacks.
The black lines on the map illustrate the approximate location of the 15 tunnels crossing into Israel. The red shaded area along the Gaza-Egypt border represents the area were 1,642 smuggling tunnels are reported to have been found and destroyed. The estimated range of Hamas’s tunnels into Israel can be seen on the map indicated by the red 2 kilometer tunnel range line. Additionally, the extent of the IDF’s ground operation into Gaza to clear tunnels is highlighted by the green 3 kilometer buffer line.
As you can see, several tunnel routes and damage clusters overlap.
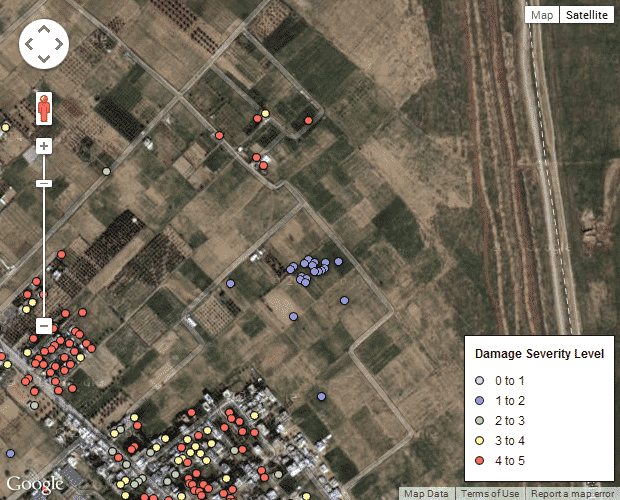
Apart from the tunnels, other interesting factoids appear from viewing the OCHA damage points over satellite imagery, such as my caveat regarding the veracity of the locations and data collection.
For example, these handful of houses, sheds and huts were claimed to have sustained no less than 34 severe damage points.
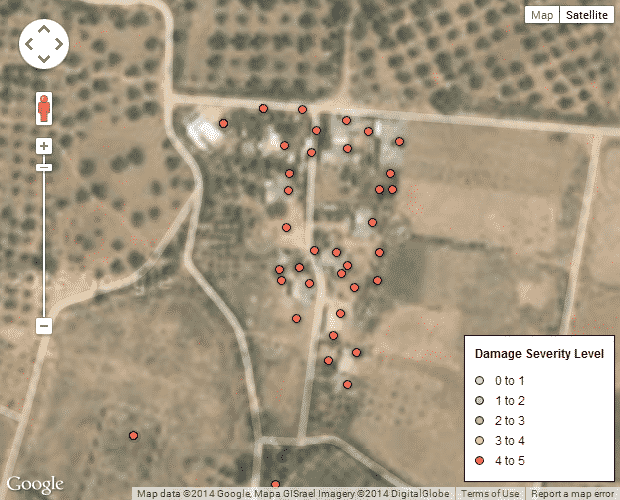
Keen eyes will also spot the severe damage point smack in the middle of a field (bottom left).
Let’s not forget the odd point in the ocean, the lack of damage points on Hamas marine police HQ in Gaza harbor, or the chains of adjacent green houses sporting one damage point each. While I do agree that for the most part these points are accurate, one cannot escape the sense OCHA were at times very lax about their data quality.
There is however one positive aspect of these points: identifying Hamas compounds. Several of them are placed in the dune areas west of Khan Yunes.
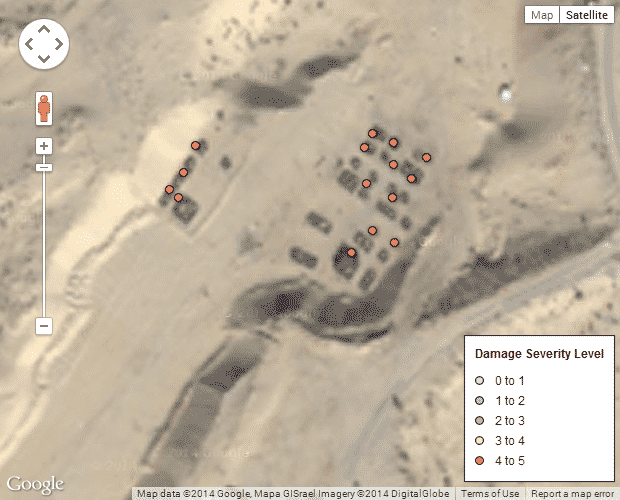
This second image has an irony to it. The reservoir-like depression in the ground was actually the Bdolach oxidation pond – a sewage pond, which was part of the Gush Katif waste water treatment facilities. That Hamas is sh*t we know; now there’s proof they hide and train in it too.